Plan with clarity Execute with confidence Stay ahead with every task on track
Track every stage, task, and deadline with an interactive timeline that keeps your team on track — with clear planning and precise execution.
Overview of the Gantt Chart Feature in Wroke
Discover how the Gantt Chart in Wroke can transform the way you organize your projects and give you full control at every step.
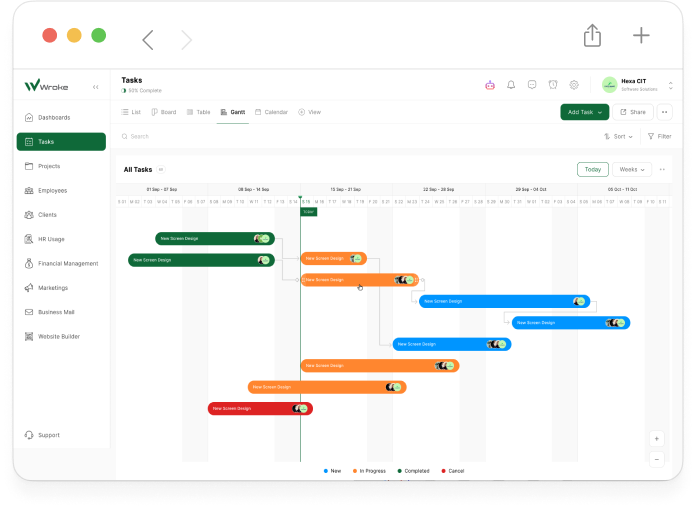
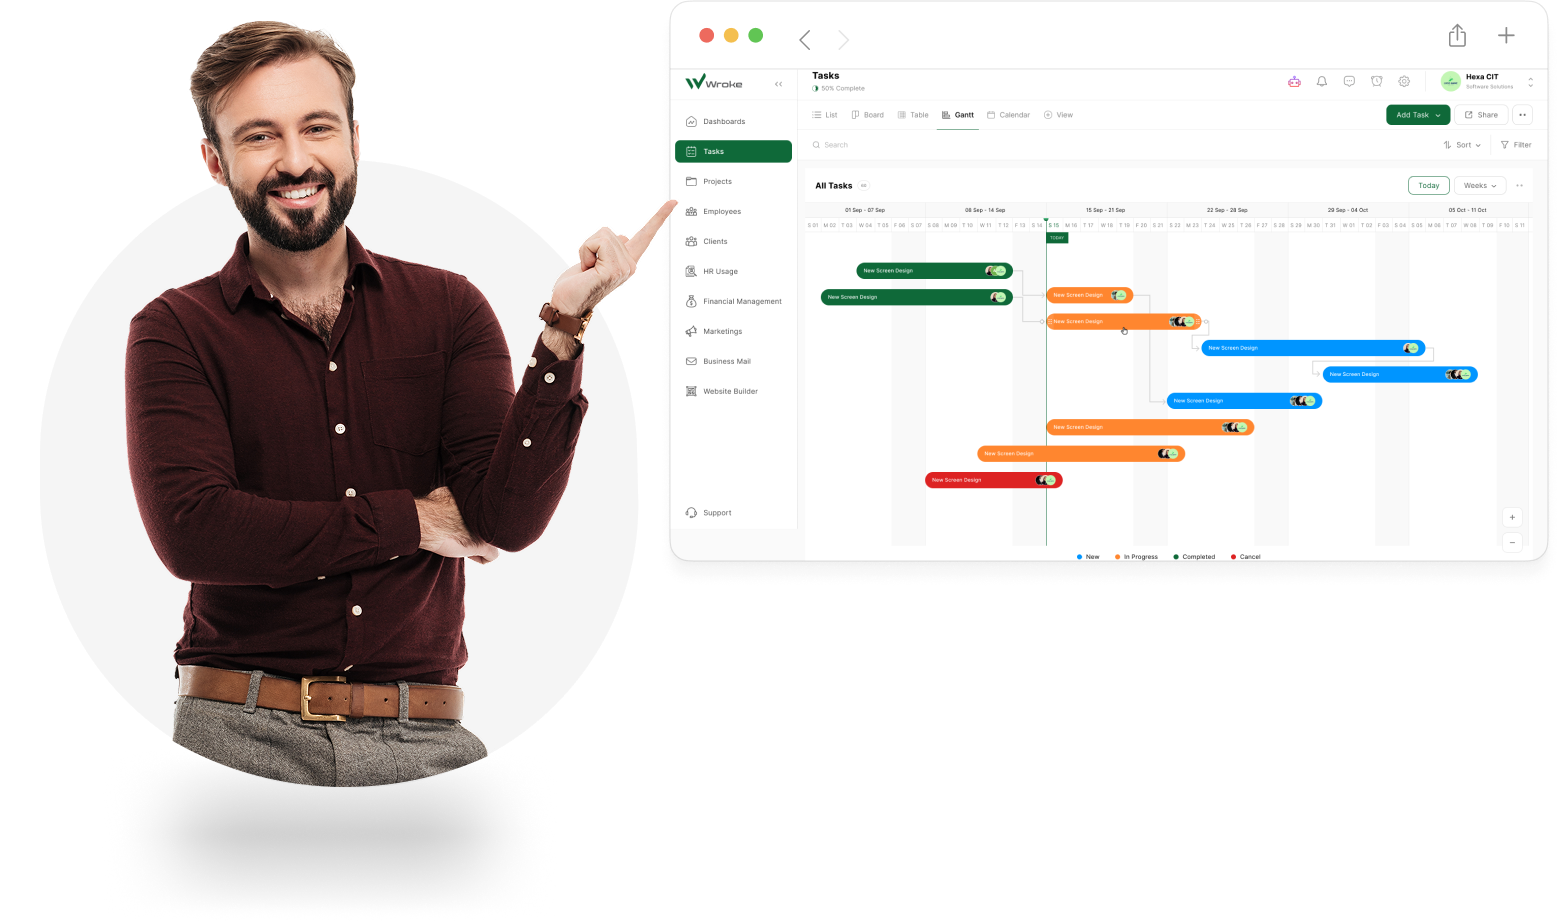
The Gantt Chart feature in Wroke offers a clear and organized visual timeline that displays all project phases and task schedules. It helps you easily track the start and end dates of each task, understand dependencies, and monitor progress at a glance. This tool improves team coordination by providing a shared view of deadlines and task statuses. Designed for simplicity and efficiency, the Gantt Chart enables better planning and resource management, helping teams meet deadlines smoothly..
Discover the Power of Wroke’s Gantt Chart to Boost Your Projects
Discover how the features of Wroke’s Gantt Chart help you plan and manage your projects easily and achieve better results.

Clear Project Overview
The Gantt Chart in Wroke allows you to visualize the entire project at a glance, from start to finish, with a clear visual representation of the task timeline and their relationships, enabling better understanding and smarter decision-making.

Precise Task Scheduling
You can assign precise start and end dates to each task, organizing them on the timeline in a carefully planned and structured manner, ensuring a smooth workflow without missing any critical steps or experiencing any delays that could impact project progress.

Enhanced Team Coordination
The chart provides a comprehensive shared visual platform that enables every team member to clearly see their assigned tasks and deadlines, enhancing effective collaboration and greatly reducing the likelihood of conflicts or duplicated work.

Real-Time Progress Tracking
Wroke allows you to update task statuses in real-time with high accuracy, enabling you to detect any delays or obstacles as soon as they occur and take swift action to adjust plans or reassign tasks effectively, ensuring the project proceeds smoothly without interruptions or setbacks.

Effective Time Management
The Gantt Chart in Wroke helps you effectively meet deadlines by precisely tracking task progress, allowing you to continuously monitor the status of each task, greatly reducing last-minute pressure, and ensuring a smooth and balanced workflow throughout the project duration without interruptions or delays.

Smarter Decision-Making
Thanks to the detailed & continuously updated visual data provided by the Gantt Chart, you can quickly & flexibly reorder task priorities & adjust the project plan based on actual performance & real-time insights, helping you make informed & effective decisions that ensure smooth project flow & timely achievement of goals.

Risk Reduction
By having complete clarity about tasks and precise dependencies between them, the risk of stumbling or failure resulting from poor communication or poor planning is greatly reduced, as this allows the team to better understand responsibilities and coordinate effectively between members.

Boosted Productivity
Thanks to the visual organization and complete clarity of workflow, the team can work with higher efficiency and better focus on core tasks. This leads to improved quality of task completion in less time, while boosting productivity and reducing waste and duplicated efforts.
How does the Gantt Chart work in Wroke?
Discover the smart way Wroke’s Gantt Chart organizes your tasks effectively, giving you full control over your project’s progress and helping you achieve your goals quickly and easily.
Project planning becomes easier, task tracking more precise, and meeting deadlines guaranteed.

The process of working with a Gantt chart in Wroke begins by breaking the project down into a set of precise and clearly defined tasks, with specific start and end dates for each one. These tasks are then arranged on a visual timeline that clearly shows their logical order, as well as the dependencies between them—meaning which tasks must be completed before others can begin. With this approach, you can track the project’s progress step-by-step, updating the status of each task instantly on the chart. This allows you to spot any delays as soon as they occur and take the necessary actions to address them promptly. This visual system not only makes it easier to understand the project’s workflow and various phases but also strengthens coordination among team members by giving everyone a clear view of the full picture and their specific roles. The result is a higher guarantee of meeting deadlines, completing projects with greater efficiency and quality, and reducing the risks that arise from poor organization or weak communication.